HomeLearnTopicsUsing Better Data for Condition Monitoring Location Optimization

Using Better Data for Condition Monitoring Location Optimization

What Is Condition Monitoring Location Optimization?

Condition Monitoring Locations (CMLs) are specified areas on piping and pressure vessels where thickness measurement examinations are performed to observe the presence and rate of damage and corrosion occurring within an asset. CML selection is an inspection strategy used to drive mechanical integrity and mitigate potential risks in a cost-effective way.

CML optimization ensures effective CML coverage and placement by determining the most appropriate monitoring locations on an asset. CML optimization makes inspection efforts more efficient by focusing on areas where degradation is likely to occur, resulting in an elimination of unnecessary CMLs that will not provide value, and, at times, an addition of CMLs where necessary. Overall, the goal of CML optimization is to target high risk areas and effectively allocate resources. In the cases where CMLs are greatly reduced, resources can be reallocated to monitor other damage types through advanced Nondestructive Examination (NDE) techniques.

DDR

How Can Data-Driven Reliability Improve CML Optimization


Data-driven reliability is the framework for reliability improvement that connects data extracted from CML Optimization to your business decisions. This framework leverages reliability intelligence, a unique combination of data science and engineering models, to equip facilities with the information they need to drive sustainable operations. As these models learn and adjust from previous patterns, facilities are able to make appropriate CML coverage adjustments, minimizing the number of preventative maintenance tasks that need to be performed.

How to Select and Optimize Condition Monitoring Locations

As the industry continues to evolve, the approach to CML selection will evolve as well. While traditional qualitative approaches are easily implemented, they are also subjective. Sometimes, inspectors or engineers do not consider expected damage mechanisms when selecting CMLs. Instead, they may decide to examine multiple locations in hopes of capturing degradation. This approach can lead to one of two issues: excessive CMLs where damage is not likely to occur or not enough coverage where damage is likely to occur.

Technological advancements in data acquisition, warehousing, modeling, and analytics are now paving the way for enhanced reliability analysis, making approaches such as Quantitative Reliability Optimization (QRO) possible. With these advances, it is now possible to use quantitative engineering statistical methods to optimize CML placement and achieve high confidence levels that the designated CMLs are effectively monitoring asset degradation.

An international oil and natural gas company owns and operates multiple offshore platforms in the Gulf of Mexico. Due to their locations in the Gulf of Mexico, the platforms had a significant amount of external corrosion and corrosion under insulation (CUI) on piping and various pieces of equipment, contributing to loss of containment and downtime. CMLs for the platforms were established using a blanket approach, without considering expected damage and asset consequence of failure, resulting in thousands of CMLs placed across the company’s platforms.

One platform’s piping had 7, 912 CMLs and its equipment had 1,146 CMLs. Despite the high number of CMLs placed, confidence in asset integrity was low due to recurring corrosion-related issues. The number of CMLs also created many cost and process inefficiencies for the inspection program.

By implementing a CML placement optimization strategy, piping CMLs were reduced by 78.8% (CML count went from 7,912 to 1,680) and equipment CMLs were reduced by 60.7% (CML count went from 1,146 to 450). Although there was an overall reduction in CMLs, these updated CML counts also include new CML placements and a variety of new inspection techniques. As a result of the CML optimization process, the company is now able to better leverage existing resources and now has increased confidence in its asset integrity.

Read the full case study: Overcoming Corrosion-Related Challenges Through Condition Monitoring Location Optimization

A refinery in North America experiences varying amounts of corrosion in certain areas of piping across three different units. Due to the high corrosion in parts of some units, these stretches of piping are replaced at their respective three or four-year turnaround cycles, and as a result, the thinning data being captured has a short effective period with which to do predictive modeling. The company had an overarching goal to reduce and better manage operating risk across all sites and implemented a multiyear initiative to analyze the piping circuits and pressure vessels using risk-based inspection analysis and corrosion monitoring with commensurate inspection interval processes.

CML Prioritization by the methodology presented in this case study is a new CML Optimization solution and predicts future thinning based on past performance from that same CML across repairs and replacements, ranking CMLs by the risk posed to safety and production prior to the next scheduled action (repair/replacement/inspection/turnaround) taken on that CML. Unlike traditional methods, CML Prioritization takes degradation rates and uncertainty of the facility’s data into account which impact the accuracy of predictions.

In this study, the date was set as the second next turnaround of each unit, so that if the thinning threat measured by a CML would cause a loss of primary containment, it could be replaced or repaired in the closer turnaround event. Additionally, this approach identified CMLs that indicated asset failure within the next one to two years, prior to the next inspection event, and required immediate attention by the facility. The estimated business impact to the facility resulting from the optimization analysis and resulting prioritization scheme is minimally $384,000 in reduced inspection spend over the next two turnaround cycles. The savings are due to postponement of non-value-adding inspection activities and inspection scope, resulting from the reduction in recommended CML monitoring as well as a decrease in inspection frequency.

Read the full case study: CML Optimization Pilot Project Helps Refinery Reduce Risk and Identify Minimum Reduced Inspection Spend of $384K

How Quantitative Reliability Optimization Drives CML Placement and Statistically Increases Confidence in CMLs

Quantitative Reliability Optimization (QRO), is a dynamic reliability analysis model that builds upon the best elements of existing reliability models by introducing new data science and analytical concepts. This model drives improved and strategically balanced availability, process safety, and spending performance.

To see how QRO can be leveraged to achieve optimal CML coverage, let’s take a look at three example damage modes:

In this example, QRO methodology was leveraged to optimize CMLs for a piping circuit subject to general degradation. Before applying the QRO model, the piping circuit had 27 CMLs. Data routinely collected for the piping circuit over the past couple decades shows a spread in thickness values and variability in degradation. The data collected validated the corrosion model that was generated.

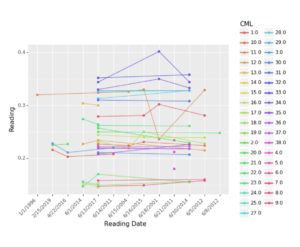
Figure 1 – Historical thickness data for piping circuit


Leveraging QRO, a lifetime variability curve was ran on every CML to project future thickness. This is a stochastic, or uncertainty-based projection. As shown in Figure 2, at a certain point in time, when the next inspection is due, there is a range of various thicknesses for every CML. Some are higher or lower, either due to starting thickness or due to corrosion rate. And some are going to be wider, which indicates a high degree of variability in the corrosion rate, and therefore, the expected thickness in the future.

Projected Thickness Per CML in 2020

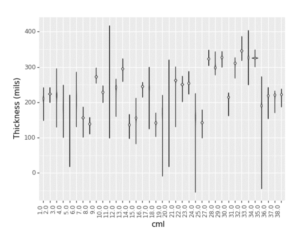
Figure 2 – Projected thickness per CML in 2020


Using a quantitative analytic method, such as that provided in QRO’s lifetime variability curve, the value of inspecting each of these CMLs was assessed. For example, it was discovered that some of the CMLs will provide very little value in the next inspection and are not recommended for monitoring. On the other hand, other CMLs are highly valuable, either due to known degradation or the potential for high degradation. After the analysis, it was found that a 95% confidence level can be statistically achieved by monitoring seven of the original 27 CMLs. Therefore, using this analysis method, highly effective inspections can be performed while also being very targeted with limited inspection resources.

CML Selection

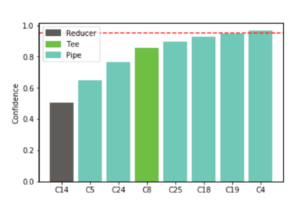
Figure 3 – 7 CMLs provide a 95% confidence level that the low point would be identified

In the next example, QRO methodology was leveraged to optimize CML coverage for a heat exchanger tube bundle with no historical thinning data. This tube bundle had 148 tubes and 44 of the tubes were recently inspected. From those inspections, localized thinning was identified in four tubes. Based on the results of the inspection, a question arose: “What is the confidence level that all tubes with localized thinning were found?”

Upon analysis, there was only a 14% probability that all tubes with localized thinning were found. To achieve a confidence level of at least 90%, 85 tubes need to be inspected. In this case, a higher level of confidence was needed, based on the importance of the asset.

Coverage Requirements to Find All Tubes with Pitting in Future

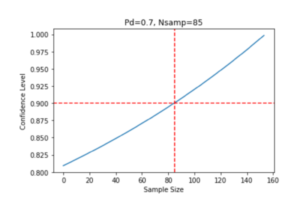
Figure 4 – Inspecting 85 tubes will provide a 90% confidence level

Even though there was not a lot of quantitative data going into the inspection, the initial inspection sample was still able to be optimized and the owner/operator is able to adjust on the fly if additional coverage is needed, based on results of the inspection and the quantitative data that was obtained.

After adequate collection of quantitative data, a statistical analysis leveraging the lifetime variability curves was ran to assess what the expected lowest thickness value is at any point in time. The analysis found the minimal thickness to be 0.078-0.080 inches, with a 95% level of confidence. This information can be used to further optimize future inspections and any maintenance that needs to be performed.

Extreme-Value Analysis to Predict Minimal Thickness in Remaining Population

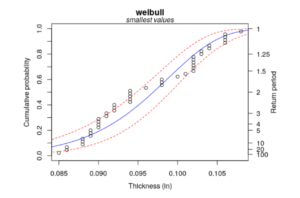
Figure 5 – There is a 95% confidence level that the minimal thickness is 0.078-0.080 inches

The final example highlights how QRO methodology makes it possible to analyze the tradeoffs between increasing inspection intervals and the risks associated with that decision. Should the decision to increase inspection intervals be made, QRO can identify the level of inspection coverage necessary to achieve appropriate levels of confidence in the future inspection.

An overhead accumulator was inspected in 2020, with 10% of the welds examined. Running an API 581 statistical analysis based on the population sampled, there is a 6% chance that cracks are present in other welds that were not inspected. By rerunning the probability (POF) of failure calculation, it is evident that there is a negligible impact on the POF. This means that another cracking inspection will be due sometime in the near future.

Probability of Failure Per Year

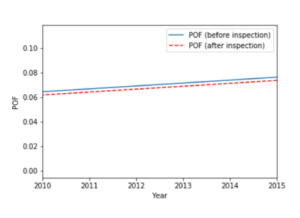
Figure 6 – The inspection provided negligible impact to POF


Going back and looking at the data before the inspection was completed, the analysis can be used to identify the level of inspection coverage needed to achieve a 95% confidence level of identifying existing cracks. To achieve this level of confidence, the analysis found that a 15% area of coverage would have been required for the 2020 inspection.

The analysis can also be used to play “what-if.” What if the 2020 inspection had not been performed? Because POF changes over time, coverage requirements will change as well. With QRO, the owner/operator can run an analysis to see what level of coverage would be required to achieve an adequate amount of coverage if waiting 10 more years to perform the inspection. In this particular case, the analysis found that an inspection pushed to 2030 would require a 90% surface area inspection to achieve the 95% confidence level of identifying cracking. Again, this is a specific example of QRO enabling flexibility between risk level, inspection coverage, and inspection timing.

Future Optimization

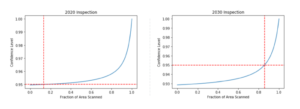
Figure 7 – Inspection coverage required to achieve a 95% confidence level: 2020 vs 2030

White Paper

For more information about how QRO can be leveraged for CML optimization, read our white paper Quantitative Reliability Optimization (QRO) Example Application: CML Optimization.

Conclusion

CML optimization is a great strategy for performing targeted inspections and being efficient with limited resources. By leveraging the quantitative analysis provided by QRO, owner/operators can truly optimize CMLs for effective inspections and efficient allocation of resources. It even allows owner/operators to look into the future and understand how risk will change and what levels of inspection coverage will be required at any point in time. With these capabilities, QRO provides the quantitative confidence to balance risk and cost and to make effective decisions surrounding inspection coverage and timing.

Learn more about Quantitative Reliability Optimization (QRO).

 
Want to explore how QRO could impact your facility's reliability?

Stay in the know.