What Is a Lifetime Variability Curve (LVC)?
Facilities can work towards achieving system-wide reliability with Quantitative Reliability Optimization (QRO). QRO helps facilities maximize reliability performance by balancing metrics such as production targets, Health, Safety, and Environment (HSE) risks, and the costs required to manage those risks effectively.
QRO is comprised of four elements: Asset Risk Analysis (ARA), the Lifetime Variability Curve (LVC), system view, and task optimization. The second component of QRO is the LVC.
An LVC is a data-driven model that leverages a facility’s reliability data to estimate asset performance, predict failure, and quantify uncertainty. With QRO, the LVC can generate a probability of failure (POF) curve, helping facility leaders better forecast system availability.
How Does an LVC Work?
LVCs work similar to a hurricane tracker – as the model collects more real-time data, it becomes more refined and better predicts when assets will fail. LVCs can be used for both functional failures and asset degradation.
LVCs start by taking existing data points and combining them with subject matter expertise and process data to forecast how the asset will change over time. As the LVC collects data, the model continues to refine itself.
Getting More from Your RBI Program through Lifetime Variability Curves (LVC)
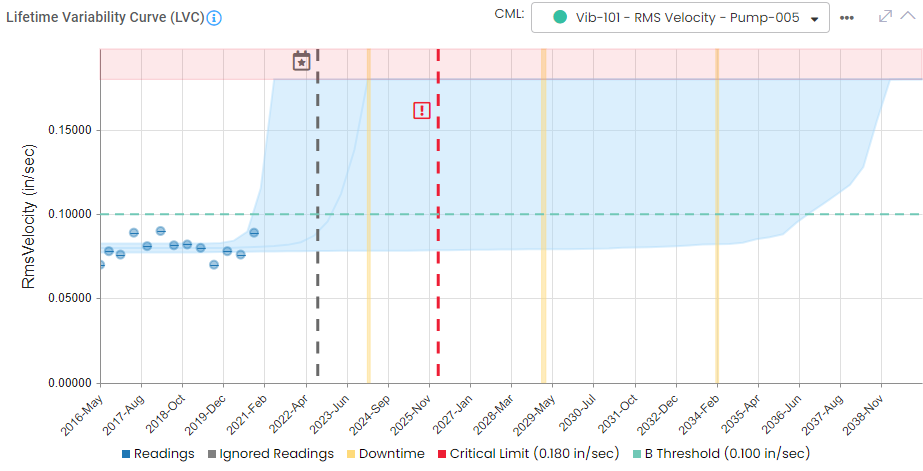
For example, an LVC can be applied to the vibration of a bearing in a centrifugal pump. The LVC helps predict when the vibration of the bearing will cause the pump to stop functioning.
In Figure 1, the LVC leverages existing vibration measurements to predict when the bearing will fail. Since there is not a particular trend with existing data points, the model predicts a wide band of uncertainty.
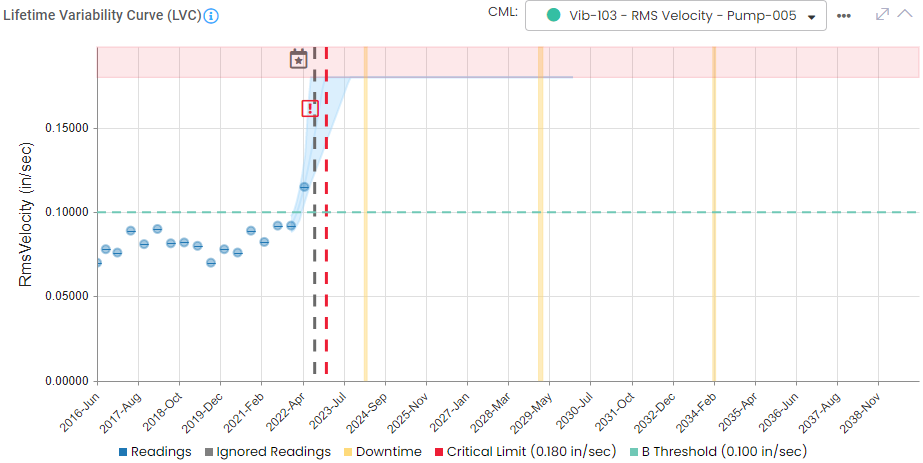
As the LVC is fed more data, the model continues to refine itself, quantifying a POF curve. As a result, the model is able to create a more accurate band of uncertainty as seen in Figure 2.
Benefits of an LVC
With the incorporation of an LVC, facilities are able to do the following:
- Leverage a POF that is continually refined based on facility data instead of a static POF
- The ability to collect more data at the correct time, helping them justify spending and better identify the optimal time to perform maintenance activities
- Process information in real-time without having to go out into the field to take measurements
- Blend process data and subject matter expertise to help facilities avoid over-collecting data in some areas and under collect in other areas.
CML Optimization Pilot Project Helps Refinery Reduce Risk and Identify Minimum Reduced Inspection Spend of $384K
Pinnacle implemented a data science enhanced CML Optimization process. The methodology, known as CML Prioritization, uses predictive analytics to forecast future thinning based on past performance of a specific CML considering repairs and replacements. It prioritizes CMLs according to the risk they pose to safety and production before the next scheduled action. Unlike traditional methods, CML Prioritization takes into account the degradation rates and the uncertainty of the facility’s data, which can impact the accuracy of the predictions. This approach also establishes a dynamic model that can be regularly updated to optimize reliability and return on investment (ROI) based on the latest information available.
Stay in the know.
Providing data-driven insights, perspectives, and industrial inspiration from the forefront of the reliability transformation.