Learn how a Quantitative Reliability Optimization (QRO) pilot helped a global energy company ensure its reliability investments were properly focused to maximize availability and minimize risk.
Challenge
Despite implementing initiatives such as RBI, RCM, and real-time monitoring, facility leadership remained uncertain that they were investing in the correct places.
Solution
The facility initiated a QRO pilot which enabled them to build an accurate reliability prediction model for all asset types. The facility received a tailored maintenance, monitoring, inspection and repair, replace, upgrade plan.
Result
QRO enabled the facility to validate, identify, and prioritize new activities and tasks that will result in a 0.9% increase in availability and a $3.29MM production increase over the next 10 years, with no additional spending.
The Challenge
An energy company with global operations concentrated primarily in Europe, North and South America, and Asia is known for its integrated upstream and downstream operations. Over the past 10 years, one of the company’s largest and historically most profitable refineries experienced a significant drop in plantwide availability.
Three years ago, the facility’s leadership chose to focus improvement efforts on the hydrocracker unit – a primary contributor to the drop in availability. As a result, the facility initiated a series of asset management improvements, capital upgrades, and performance improvement plans. The goal of these initiatives was to maximize the availability of the hydrocracker.
Upon the completion of these activities, however, facility leadership remained uncertain that these initiatives would actually enable them to achieve their availability goals. For example, while the facility recently completed a Risk-Based Inspection (RBI) program implementation and a Reliability Centered Maintenance (RCM) study for critical assets, these approaches seemed too subjective, overly conservative, and static. These methodologies could not guarantee the availability improvement results the leadership team was seeking.
Facility leadership wondered: “Should we be doing more? Are we spending too much? How can we be certain that the actions we are taking are worth the investment?” They needed more confidence that planned maintenance, monitoring and repair, replace, and upgrade activities were worth the investment and that they would ensure a step change in availability.
Pinnacle's Solution
Quantitative Reliability Optimization
To answer the above questions, facility leadership decided to pilot Quantitative Reliability Optimization (QRO). QRO is a data-driven methodology that enables facility leaders to simplify and improve complex reliability decision making through a hybrid approach to reliability modeling. This hybrid approach combines the risk assessment of both fixed and non-fixed assets into a single model, removing silos in data and providing facility leaders with better insight into how they can reduce unplanned downtime, increase safety, and improve spending performance with statistically backed confidence.
QRO was developed by synthesizing the best elements of traditional reliability methodologies with data science principles and leveraged subject matter expertise (SME) to close the gaps in current programs. Just as RCM and RBI were forward leaps for reliability, QRO is the next advancement of reliability modeling.
Facility leadership chose to pilot the QRO methodology for three primary reasons. First, QRO leverages the facility’s existing data to predict future availability. Second, QRO can accurately forecast the probability and consequence of failure for fixed and non-fixed assets for facilities that have limited data. In these cases, QRO uses industry analytics and subject matter expertise to populate data models. Third, QRO can update predictive models in real-time with live data connections including process, monitoring, work order, and task data allowing risk and mitigation plans to remain evergreened.
The implementation of a QRO pilot occurs in three primary phases:
Phase 1
A valuable unit or complex that aligns with the facility’s objectives is identified. Within this unit or complex, the asset register that incorporates all critical asset types from the facility’s existing systems is loaded into Newton™, Pinnacle’s software application that facilitates the QRO methodology. Next, a connected unit model is created to set the foundation for facility-wide reliability analysis. While initially done for a unit, this modeling can be completed for the full facility.
Phase 2
Phase 3
Phase 1
Phase 1 sets the foundation for facility-wide reliability analysis. During this phase, Pinnacle evaluated the hydrocracker unit and identified a critical depentanizer bottoms system as an area that had historically led to many of the unit’s availability issues. Selecting this specific system helped facility leaders (1) take a step toward a quantified validation of recent repair, replace, and upgrade initiatives, (2) identify additional activities to further improve reliability, and (3) remove unnecessary tasks.
The first step in creating the foundation for facility-wide reliability analysis is to build a model of the unit in Newton™. Leveraging the asset register from the existing Computerized Maintenance Management System (CMMS) and Inspection Data Management System (IDMS), as well as data extracted from the facility’s Process Flow Diagrams (PFD) and Piping and Instrumentation Diagrams (P&IDs), the unit reliability model creates asset interdependencies that are later used to calculate unit-level availability, risk, and cost.
Leveraging the asset’s failure modes, the POF is then calculated for each component of each asset through Lifetime Variability Curves (LVCs). An LVC is a dynamic model that predicts the probability of failure (POF) of a component by leveraging data science principles, subject matter expertise, and the facility’s live data. The LVC dynamically updates as new inspection, test, and monitoring data enters the model, resulting in a more refined POF curve for the asset. Next, the consequence of failure (COF) of each asset is calculated based on the facility’s Health, Safety, Environment (HSE) data, maintenance costs, and production losses. The COF is calculated through a combination of API 581 calculations and Newton’s™ facility model algorithms. Additionally, the estimated failure dates, risk, and availability is calculated.
A complicating aspect of this facility’s data—and many facilities in the industry—was a lack of trustworthy historical data. For example, the facility only had one to two trustworthy historical thickness readings for numerous pieces of fixed equipment within this unit. To combat this challenge, the facility leveraged LVCs. A core capability of an LVC is its ability to forecast condition monitoring location (CML) failure dates with no data points. In cases when little data is available, the LVCs apply an uncertainty band that adjusts as data is added. For example, if actual readings confirm corrosion rates calculated by subject matter experts (SME) are correct, the uncertainty bands are tighter together. When little to no data is available, the uncertainty bands are wider. Wider uncertainty bands compensate for the lack of data and allow the user to prioritize where additional data would make a meaningful difference in facility-wide availability. The figure below illustrates this concept.
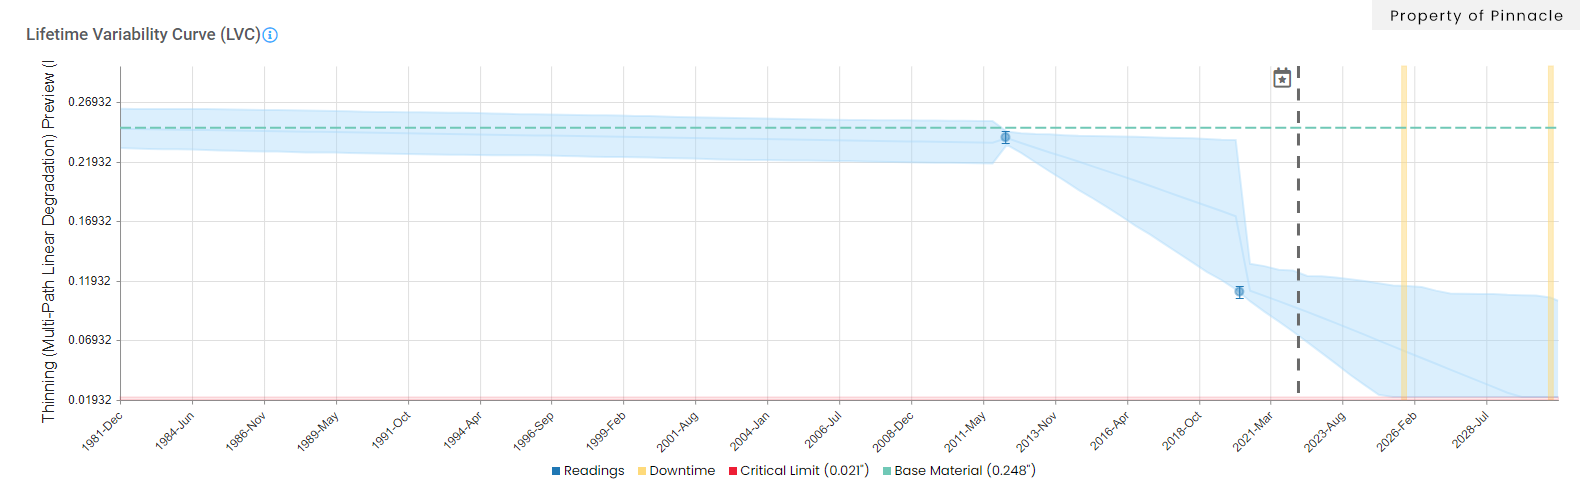
This particular LVC indicates that a failure is likely to occur between turnarounds (vertical yellow bands), however the potential for failure exists today. Therefore, Newton™ will prioritize an inspection activity at this location in the near future to verify corrosion and reduce statistical uncertainty.
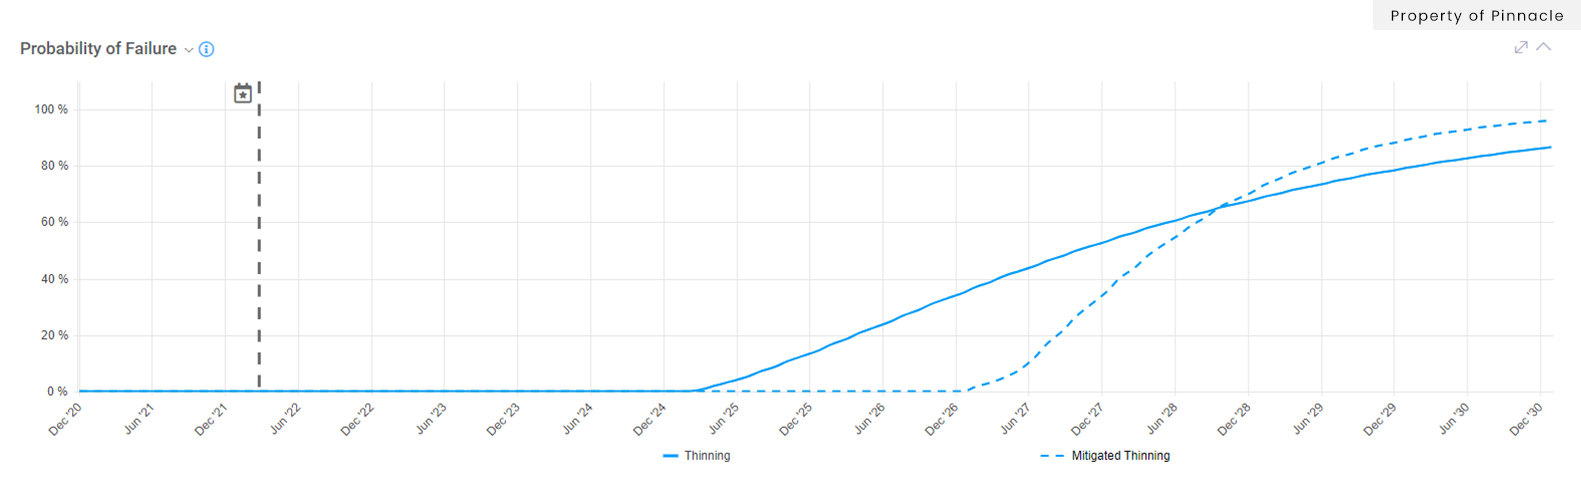
This curve, derived from the LVC, reflects the most likely failure point on the entire line and is driven by one of the CMLs on the line.
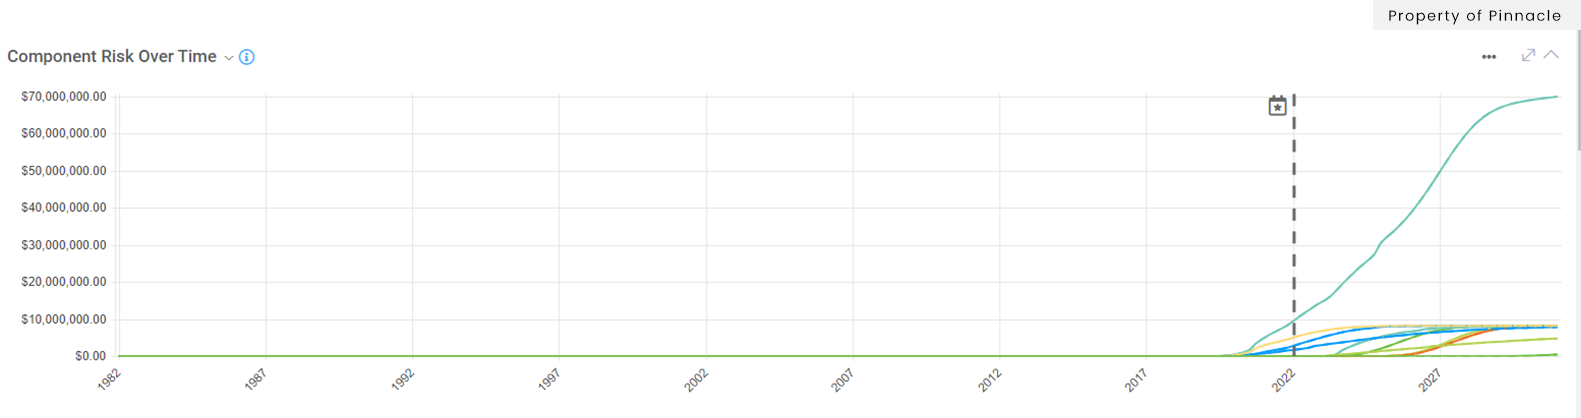
These curves provide a visual representation of forecasted risk for each line and highlights the highest risk line(s) in the circuit.
Phase 2
Phase 2 takes a deeper dive into the facility’s maintenance, inspection, repair, and replacement history and combines the asset interdependencies established within the unit model with the individual asset’s Asset Risk Analysis (ARA), POF, and COF to establish baseline availability and costs for the unit. This enables the user to manage facility-wide availability impacts instead of having to manage on an asset-by-asset basis.
In this pilot, an ARA was created for each asset within the depentanizer bottoms system. An ARA combines the first principles of engineering analyses with asset data, field execution limitations, and operational constraints. The ARA assesses the risk of each asset within the depentanizer bottoms system by evaluating all available asset data and calculating the POF, COF, estimated failure dates, risk, and availability. Additionally, the functions, failure modes, and failure mechanisms for each asset are identified or loaded from existing RBI and RCM assessments.
For this facility, all available historical data, which was limited, was uploaded into Newton™. This data was primarily extracted from the facility’s IDMS, CMMS, and other inspection reports, data historian reports, and design documents. The facility’s historic and planned tasks and work orders were also added to the model during this phase. The asset interdependencies established in Phase 1, combined with the ARA, POF, and COF for each individual asset, were rolled up to the sub-system level to show forecasted availability and spend over the next 10 years for the depentanizer bottoms. In addition to calculating the impact of potential failures on overall facility production, the forecasted availability also included site-validated repair costs and durations. Through Newton™, QRO identifies when the repairs will be needed and their associated impacts, a critical step needed to complete Task Optimization in Phase 3.
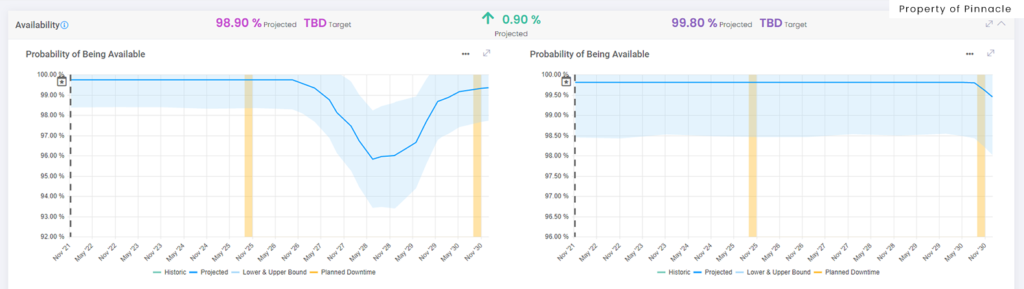
For the depentanizer bottoms sub-system, this initial analysis calculated an expected baseline availability of 98.9% over the next 10 years. While the projected baseline availability for the unit was high, the analysis predicted a few Loss of Containment (LOC) events before the next turnaround— specifically, the failure of an outlet nozzle and associated carbon steel lines. Additionally, the analysis predicted reliability failures in a shared spare pump configuration. Since facility leadership was tasked with preventing unplanned hydrocracker failure between turnarounds, action needed to be taken despite its high baseline availability forecast. Furthermore, facility leadership still questioned if there were significant non-value-adding activities that could be eliminated.
Phase 3
In Phase 3, QRO compares the impact of the facility’s current task list with the list of optimized tasks generated by Newton’s™ Task Optimization. The facility’s current task list is a list of the facility’s activities that are currently planned, along with their associated impacts to availability and spend. The second list is an inventory of optimized tasks recommended by Newton’s™ Task Optimization to achieve similar, or improved, availability and spending performance. For this pilot, specific constraints were set up so that Newton’s™ Task Optimization would recommend tasks that would achieve an improved availability without increasing risk or spending.
To develop the list of optimized tasks through Task Optimization, Newton™ requires availability, spend, and HSE risk constraints to be entered. For the depentanizer bottoms sub-system, the team set the model to produce a set of tasks that would increase the availability as much as possible without exceeding the facility’s current spend forecasts.
Task Optimization also compares the impact of unplanned outages by identifying the spending that would be needed to replace the component or asset in the pre-failure planned outage. If there is a return on investment to replace the asset in kind, Newton™ will build that recommendation into the plan during Phase 3.
Results
After piloting the QRO methodology for the depentanizer bottoms sub-system, the facility’s leadership was able to:
Validate Recent Activities
QRO was able to validate that recent repair, replacement, and upgrade activities will create a step-change in availability compared to historical availability.
Identify New Activities
The facility’s leadership received a list of new replacement and upgrade recommendations that will prevent predicted reliability issues. Furthermore, if Newton™ predicted a failure that would cause unplanned downtime, it would automatically select repair, replacement, or upgrade recommendations during planned outages prior to the predicted failure to minimize unplanned downtime.
Identify new tasks and prioritize existing tasks
QRO identified new maintenance and inspection tasks that would further improve the facility’s availability. Additionally, QRO prioritized the facility’s existing planned tasks. This result was especially beneficial for the facility since the list of recommended tasks that came from the facility’s recent RBI program implementation were poorly prioritized.
Validate Recent Activities
QRO validated that the facility’s recent activities will create a step-change in availability compared to historical availability. Overall, the team initially expected to see a lower availability forecast given the history of poor performance in the depentanizer bottoms sub-system, however recent repairs, replacements, and upgrades have improved forecasted availability.
Identify New Activities:
In the depentanizer bottoms sub-system, Newton™ identified new replacement and upgrade activities that could improve system availability by an additional 0.9% over the next 10 years, which would result in an estimated $3.29MM profitability improvement. To accomplish this, many predicted failures were automatically recommended for replacement-in-kind during the upcoming turnaround to either mitigate HSE impact or minimize economic impact. The Pinnacle team provided additional oversight for these replacements to identify where upgrades may be necessary. For example, in a particular nozzle and pipe section configuration, Newton™ automatically recommended a replacement for the upcoming turnaround that had not been previously identified by site personnel. After this discovery, the Pinnacle team conducted a deeper investigation and found that upgrading the metallurgy of this particular system would provide even greater value and was able to recommend that the facility make the replacement during the next turnaround.
Prioritize Existing Tasks and Identify New Tasks:
With QRO, the facility had the ability to objectively prioritize and plan preventive maintenance, monitoring, and inspection tasks with a high degree of accuracy. The facility’s recent API-581 RBI implementation, combined with a significant lack of historical data, caused almost all fixed equipment and piping in this circuit to be flagged as high-risk. This led to an extremely costly and inefficient list of inspection recommendations post-RBI implementation, which left facility leadership facing the prospect of making a semi-subjective determination of which tasks to prioritize. By leveraging QRO, the facility was able to pinpoint and prioritize the tasks that would have the greatest impact on the facility’s reliability, minimizing the uncertainty of the facility’s future availability. The facility’s RBI transition can now remain compliant with corporate policy and governmental regulations while also balancing cost and risk effectively.
QRO was also able to identify 100 new preventive maintenance, monitoring, and inspection tasks to further increase availability. Additionally, all unnecessary tasks were removed to offset cost increases associated with the new task recommendations.
Additionally, Newton™ identified a potential cost savings of $260K in maintenance and inspection spending over the next 10 years for the depentanizer bottoms sub-system. When extrapolated across the entire hydrocracker, the facility is estimated to recognize a cost savings of $4MM over 10 years. However, due to local regulations on inspection frequencies, some of these cost savings cannot be recognized.
While recent activities in the depentanizer bottoms sub-system have had a drastic impact on forecasted availability, there are still activities that can be performed to further improve.
Conclusion
Leveraging the QRO methodology, facility leadership was able to create a dynamic cause and effect link between every data point within the subset of assets, allowing the team to model how each asset, component, or data point impacted the facility’s long-term availability and performance. The QRO pilot for the depentanizer bottoms sub-system within the hydrocracker confirmed that there was an opportunity for improvement in availability with no additional spend.
The next steps of this QRO pilot include:
- Conducting the same level of analysis on the entire hydrocracker unit.
- Calculating the return on investment for prior replacement and upgrade tasks which will provide an objective confirmation of recent improvement activities.
- Creating revised work processes for instances where Newton’s™ capabilities can be utilized to provide a higher quality, more efficient outcome. This can be applied to PHA, Damage Mechanism Review (DMR) revalidation and risk review, criticality analyses and turnaround planning.
As Pinnacle continues to build more quantitative models, QRO will have the ability to analyze and evaluate the impact of process conditions on failure modes. Additionally, a future application of QRO will include live data connectivity between Newton™ and other facility software databases— including CMMS, IDMS, RBI, vibration monitoring platforms, real time thickness monitoring, process historian, P&IDs, and PFDs. This capability will allow the data within Newton™ to be automatically updated as more data becomes available and will help facilities immediately quantify the impact of any inspection or maintenance task on the overall risk, cost, and availability of the unit.
Stay in the know.
Providing data-driven insights, perspectives, and industrial inspiration from the forefront of the reliability transformation.