Learn how a refinery quantifies the value of its Condition Monitoring Locations (CMLs) to determine where its inspections and resources are the most effective in reducing uncertainty.
Challenge
A refinery could not confidently identify which CMLs provided optimal inspection coverage for one of its hydrocarbon reformer units and was overspending on inspections.
Solution
A Quantitative Reliability Optimization (QRO) pilot was implemented on the unit to quantify the value of its CML placements and optimize the site’s inspection budget for value-adding CMLs.
Result
The refinery is projected to gain a total value of about $800,000 over the next five years from the cost reduction and increased availability resulting from removing inspections that do not provide value and adding CMLs that provide optimal coverage.
Introduction
One aspect of an effective risk management approach focuses on eliminating the inspections that do not add value while adding necessary inspections to ensure sufficient coverage. However, even in today’s data-rich environment, many risk models rely too heavily on outdated algorithms and the conservative opinions of subject matter experts. These relative models can make it difficult for leaders to confidently define and justify future inspection plans to key decision-makers. A data-driven approach to reliability that leverages advanced modeling helps facilities quantify the uncertainty of a system’s probability of failure (POF) to drive valuable inspections that provide sufficient coverage while optimizing inspection spending.
The Challenge
A leading petroleum refiner and producer of renewable fuels with a robust mechanical integrity (MI) program in place continued to experience an increasing number of leaks at one of its facilities. To reduce the number of leaks, the site implemented a Risk-Based Inspection (RBI) approach to identify risk proactively. While this approach provided value, it required significant manual efforts from site personnel, and despite providing increased risk-based prioritized inspection intervals, the facility continued to experience unexpected piping leaks.
In addition to reducing the number of leaks, the site’s leadership wanted to better hone its resources in areas where inspections were more likely to identify active degradation while minimizing inspections in areas that returned little to no value. With its existing RBI program, the site struggled to assess the impact of specific CMLs on the overall risk of the facility and was spending its resources on inspections that did not need to be completed. Without quantifying the risk of the locations of individual inspection, they could not confidently identify which CMLs added value and which could be postponed or eliminated. Additionally, they struggled to identify areas where different types of CMLs should be added to mitigate the risk of future leaks further.
For example, one of the site’s hydrocarbon reformer units with a history of little to no degradation had more than 13,000 CMLs due for inspection over the next five years. The unit had recently completed an RBI revalidation study, and while it exhibited relatively low corrosion, the facility had not removed or delayed any existing CMLs. The site needed an approach that would quantify uncertainty and use it as a basis for the probability of failure to identify and prioritize the inspections that needed to be performed.
Pinnacle's Solution
The facility piloted Quantitative Reliability Optimization (QRO), a methodology that evaluates the impact of individual assets on the overall performance of a system by connecting reliability and integrity data to a system model. The primary objectives of this pilot were to determine and quantify the following:
- Cost-saving opportunities by identifying inspections that do not impact risk reduction.
- Opportunities to mitigate future risk by adding inspections that reduce the uncertainty and POF of a circuit.
During this pilot, a system model was created for the hydrocarbon reformer unit. This unit is comprised of a variety of circuits, including vessels, drums, exchangers, air-fin coolers, normal flow process piping, dead-leg piping, injection points, and mix points. These circuits held more than 16,000 CMLs, all of which required point Ultrasonic Thickness (UT) inspections.
The facility’s Inspection Data Management System (IDMS) data provided a baseline for the model, which predicted the unit’s future inspection costs and availability based on inspections planned for the next ten years. Future scheduled inspections were modeled to calculate the POF and associated uncertainty of each CML and circuit to measure the impact of specific tasks over the next ten years. With this quantitative model, the facility is able to determine where inspections are the most effective in reducing uncertainty.
To further evaluate the impact of inspection program changes on the unit’s availability, inspection spending, and projected risk, the team used the quantitative model to compare three potential scenarios with the baseline inspection plan.
Scenario 1a
Scenario 1a modeled the projected availability and costs of the facility’s current plan, which included inspecting all existing CMLs on their next scheduled inspection due dates. This is the expected availability based on the facility’s current CMLs and planned inspections.
Scenario 1b
Scenario 2
Scenario 3
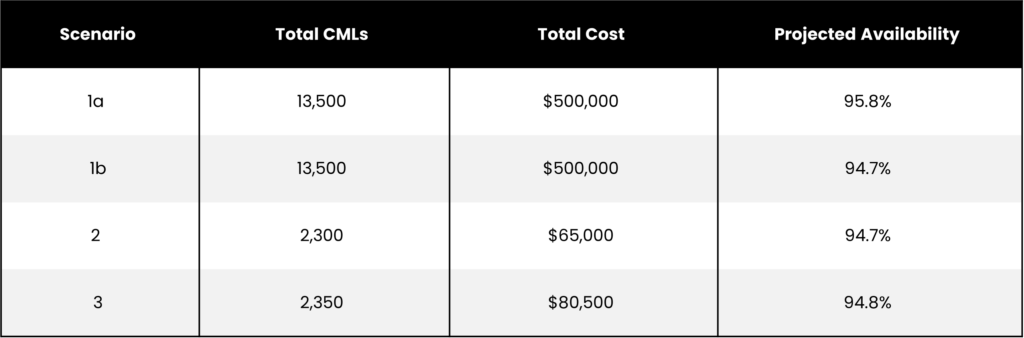
To evaluate the difference between the current inspection plan and the recommended plan generated by the quantitative model, the costs from Scenario 1a and the availability from Scenario 1b are compared to those from Scenario 3. Then, a list of optimized tasks was exported, including the techniques and dates for the planned CMLs, identifying the CMLs that should be removed or deferred, and suggestions for additional inspections during the next revalidation. In some instances, these additional inspections may require high-cost methods such as automated UT scanning, shown in the increase in total cost between Scenarios 2 and 3.
Results
Based on the pilot, the total value the refinery is expected to gain over the next five years from cost reduction and increased availability is nearly $800,000. The value consists of two primary elements:
- Cost Reduction of $400,000: The model helped the facility identify and remove more than 11,000 CMLs that added cost without adding value. The cost reduction of removing these CMLs is projected to save over $400,000 for the facility over the next five years.
- Improvement in Availability of 0.1%: The projected improved availability expected for Scenario 3 over the next five years is estimated at another $400,000 in increased production.
The pilot revealed two critical insights. First, the pilot supported the hypothesis that the facility was overspending on the inspections within the unit. Additionally, the quantitative nature of this analysis provides the basis for identifying which CMLs can be confidently removed since they did not significantly impact the amount of uncertainty present in the unit’s performance.
Second, there are opportunities for the refinery to further impact risk and availability by identifying which assets continue to contribute the most to risk and availability. Adding inspections in this use case resulted in a projected availability improvement of 0.1% over five years. Additionally, by adding inspections to small areas that showed higher degrees of uncertainty due to a lack of data, the facility is projected to recognize an additional 6% reduction of risk achieved by adding inspections to small areas that showed higher degrees of uncertainty due to a lack of data.
Conclusion
With QRO, the refinery can quantify uncertainty to drive valuable inspections that provide sufficient coverage while optimizing inspection spending. This quantitative model will allow the refinery to define, justify, and scale future inspection plans across multiple sites.
The next step for the refiner is to conduct a deeper analysis into the specific damage mechanisms and expected corrosion rates to identify where local corrosion is a significant concern and may be occurring, but inspection methods and/or coverage is not sufficient to confidently find it.
Stay in the know.
Providing data-driven insights, perspectives, and industrial inspiration from the forefront of the reliability transformation.