How to conduct Failure Modes and Effects Analysis (FMEA) in Newton™
Production facilities are large and complex. To optimize performance and manage risk, the operations and maintenance teams need to understand the equipment function, how it can fail, and the consequences of that failure. Only then can they build asset strategies that will minimize impacts from equipment failure. To accomplish this difficult task, the industry best practice is to complete a Failure Modes and Effects Analysis (FMEA). Traditionally, this is done with on-site interviews with subject matter experts (SME) and maintenance personnel that are familiar with site operations. During these interviews, the SME is asked a series of questions to subjectively determine failure modes, mechanisms, likelihood of failure, and severity of the event. The information gathered is then used to design an asset strategy that addresses the findings of the FMEA. Although this approach has some benefits, it is primarily subjective and heavily reliant on collective or passed down knowledge. It is also time-consuming and can lead to inconsistencies and strategies that are ineffective.
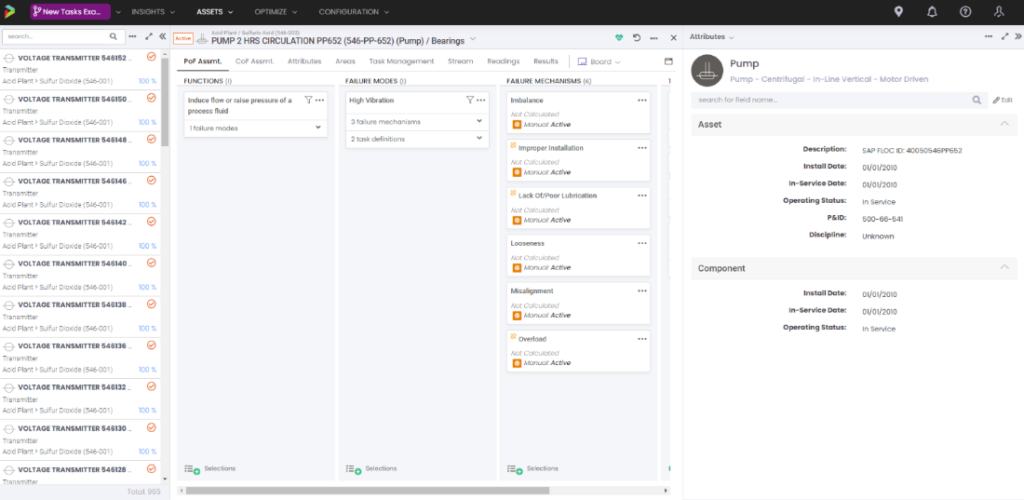
Alternatively, Newton™ offers a quantitative approach to FMEA. Newton™ connects every facet of reliability and is the only software application in the world that facilitates the Quantitative Reliability Optimization (QRO) methodology. The analysis starts by defining the asset register and creating a facility model that is used to calculate the production losses that can result from equipment failure. The Newton™ framework utilizes asset templates (fixed and rotating equipment) and walks the user through customizing each asset’s function, components, and failure modes. Leveraging data from computerized maintenance management systems (CMMS), process historians and production loss accounting; the failure modes, probability of failure, and consequences are quantified into statistical distributions, eliminating subjectivity. Lastly, this comprehensive quantitative model is calculated and used to assess criticality. From there, optimal asset strategies can be implemented from scratch, or customized from available templates. Producing asset strategies quantitatively produces results that are more specific and consistent than relying on qualitative methodology.
Moreover, the model can now be utilized to dynamically learn and update probability of failure using condition-based monitoring data. This creates an evergreen model that automatically responds to new data and threats. This also allows the user to quantify the effectiveness of the existing maintenance strategies and provides a systematic approach to continually improve their reliability program.
For example, one of the largest breweries in the world produces over 500,000 gallons of product a day. Despite having some of the most advanced technology in the world, this facility loses $50 million a year in lost production due to unplanned downtime. To minimize the amount of lost production, this facility has a goal to meet an unplanned downtime target of 3%, which equates to about $24MM in increased revenue.
To achieve this goal, each department within the brewery has to work together to achieve a common objective. While each department has its concern, a data-driven approach to reliability brings focus to an organization’s most critical actions by ensuring that everyone works toward a shared goal while meeting the individual Key Performance Indicators (KPIs) each department is responsible.
Without a specific focus, it can be difficult to know where to prioritize limited resources and which actions to tackle first to achieve this goal. For example, the primary focus of the brewing side of this facility is to mitigate any risks associated with health, safety, and the environment (HSE) that may result from equipment failure. While HSE risk is important across the entire facility, the loss of production resulting from equipment downtime is a strong focus for other departments, such as bottling and packaging. Quantifying the extent of the impact of specific failures and prioritizing tasks based on criticality is a common challenge for the industry. With a data-driven approach to reliability, this facility can link probable failures to specific failure modes to better focus on its main concerns, action the most impactful mitigation activities, and allocate its resources more efficiently.
What Makes Newton™ Different?
Conducting an FMEA in Newton™ with quantitative methodology and recommendations provide several benefits, including:
- A more accurate criticality ranking
- Cost Savings due to reduction of overly conservative recommendation
- Less time required from site SMEs
- Faster implementation through templating and data-driven analytics
- Faster time to value
- Improved production performance
- A dynamic, learning model to keep recommendations up to date
- A consistent approach used for all assets, rotating and fixed
Stay in the know.
Providing data-driven insights, perspectives, and industrial inspiration from the forefront of the reliability transformation.