Learn how we helped a large energy producer drive a more proactive maintenance approach and quantify future risk and costs by simulating thinning and vibration scenarios through a QRO pilot.
Challenge
A 1.5 MMbd gas-oil separation and stabilization facility wanted a more quantitative reliability model for its stabilization and stripping section to forecast availability and optimize its maintenance costs.
Solution
A 1.5 MMbd gas-oil separation and stabilization facility wanted a more quantitative reliability model for its stabilization and stripping section to forecast availability and optimize its maintenance costs.
Result
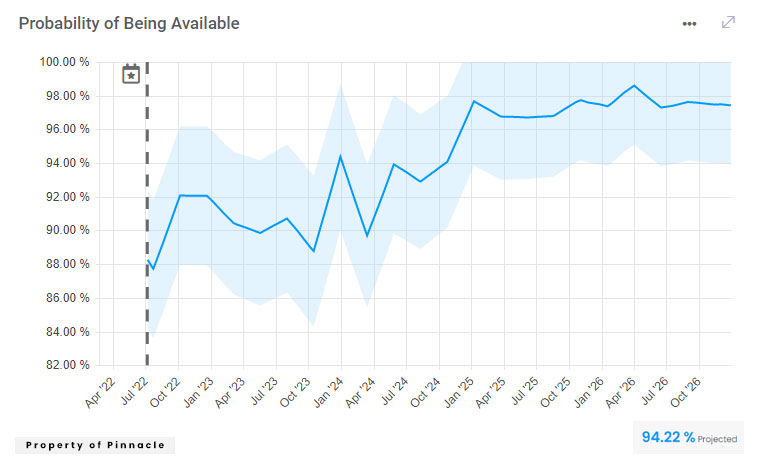
The model calculated a forecasted baseline availability of 94.22% for the 56 assets. The facility is able to drive a more proactive approach to maintenance by dynamically monitoring the impact of real-time facility data to understand its impact on availability, risk, and cost.
Introduction
A global super-major with an integrated portfolio of upstream and downstream assets wanted to better quantify its decision-making processes to maximize reliability across its fixed and non-fixed assets at one of its gas-oil separation facilities. The facility, which went into service about ten years ago, was an early adopter of technology and looked to remain at the forefront of the industry in reliability and maintenance digital transformation.
The Challenge
While the facility had implemented a risk-based inspection (RBI) program, the facility’s reliability and integrity programs operated in data silos. This siloed approach made it difficult to quantify maintenance priorities and left the leadership team with a qualitative approach to managing integrated downtime events and annual maintenance plans. This static, siloed program, coupled with the facility’s varying feed composition and rates, caused the maintenance teams to be in a constant reactive state and spend a significant amount of its budget on unplanned costs.
While management trusted their data, they were unable to quantify the future failure dates of the facility’s assets or predict how future equipment corrosion and damage across fixed equipment, rotating machinery, and instrumentation would affect the availability of the facility. Facility leadership recognized that to be at the forefront of the industry, they would need to adopt a more proactive and quantitative approach to managing assets and needed a solution that would provide three primary elements:
Scenario Comparisons:
While the risk of failure was relatively low for the facility’s assets, leadership wanted the ability to predict failure dates and visualize the impact of future corrosion and machinery issues on the facility’s overall risk.
Risk Assessment:
Facility leadership wanted to have a more comprehensive risk assessment of its assets and visualize the impact of its data over time.
Availability Forecast:
Facility leadership could not predict its assets’ future availability.
Pinnacle's Solution
While the facility had implemented a risk-based inspection (RBI) program, the facility’s reliability and integrity programs operated in data silos. This siloed approach made it difficult to quantify maintenance priorities and left the leadership team with a qualitative approach to managing integrated downtime events and annual maintenance plans. This static, siloed program, coupled with the facility’s varying feed composition and rates, caused the maintenance teams to be in a constant reactive state and spend a significant amount of its budget on unplanned costs.
While management trusted their data, they were unable to quantify the future failure dates of the facility’s assets or predict how future equipment corrosion and damage across fixed equipment, rotating machinery, and instrumentation would affect the availability of the facility. Facility leadership recognized that to be at the forefront of the industry, they would need to adopt a more proactive and quantitative approach to managing assets and needed a solution that would provide three primary elements:
- Calculated Availability:
The Pinnacle team calculated the availability forecast for the oil train by leveraging the asset interdependencies from the system model with the dynamic LVC and PoF curves.
- “What If” Scenario Comparison:
The facility was able to run various “What If” scenarios for the oil train through the Scenario Comparison module in Newton™ to simulate the impact various failure modes have on an asset’s failure date. During this pilot, the facility modeled a severe thinning scenario on a dehydrator and an excessive vibration scenario on a pump.
- Final Results:
At the conclusion of the pilot, the facility received an availability forecast, risk results, and scenario comparisons, described in more detail below.
With QRO, the facility was able to model two “What If” scenarios based on current data and visualize the impact that specific measurements have on the long-term risk of the asset. Two of these “What If” scenarios have been detailed below, including a severe thinning scenario for a dehydrator and an excessive vibration scenario for a pump. With both these examples, management was able to quantitatively predict equipment damage and associated risk to enable better maintenance and inspection planning.
Scenario 1: Thinning
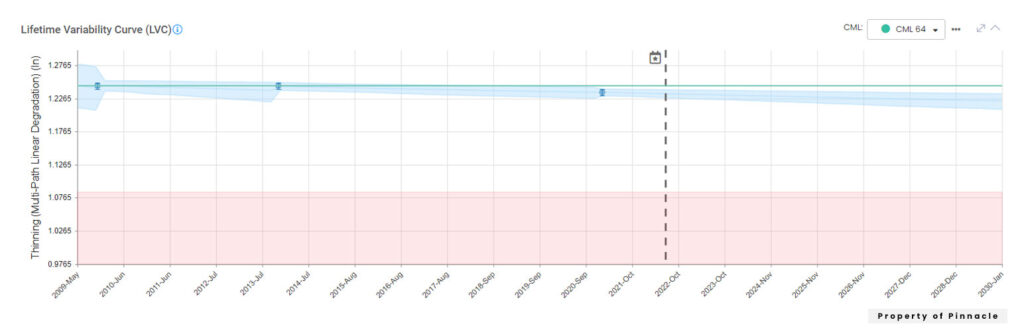
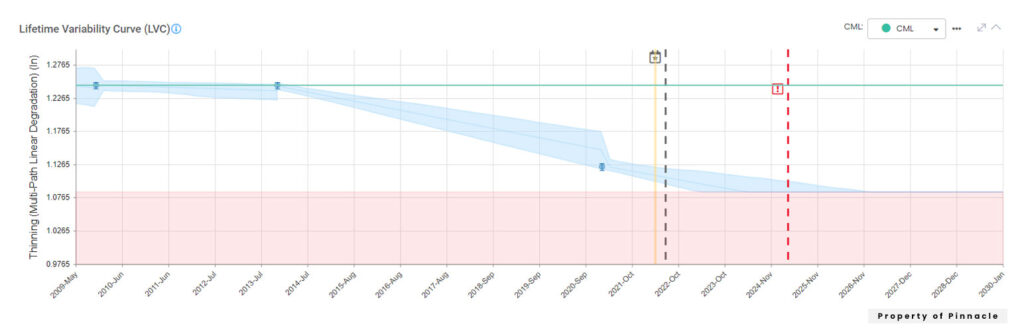
However, the facility wanted to visualize what would happen if the dehydrator were to experience severe corrosion. To model this scenario, the Pinnacle team replaced the most recent thickness measurement with a lower value. Figure 2 shows the updated LVC with a new predicted failure date of March 2025 and an updated band of uncertainty, displayed in blue.
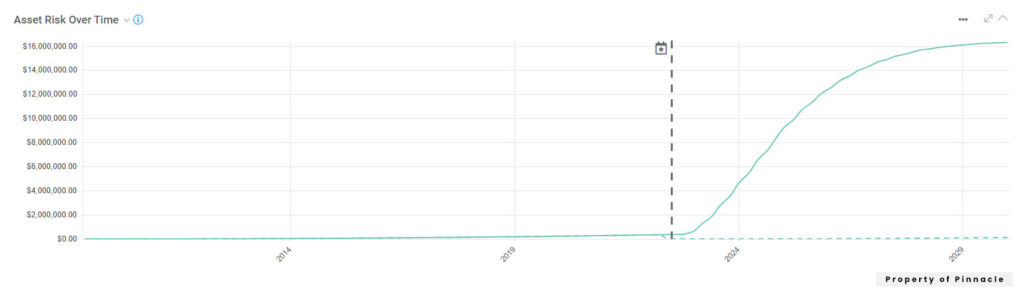
To demonstrate the decision-making and planning functionality of Newton™, a repair task was planned for the dehydrator. The results of this plan can be seen in Figure 3, which displays the current and mitigated risk curves. With the addition of a planned repair task, the “risk with plan” curve (dashed grey line) drops to zero.
Scenario 2: Vibration
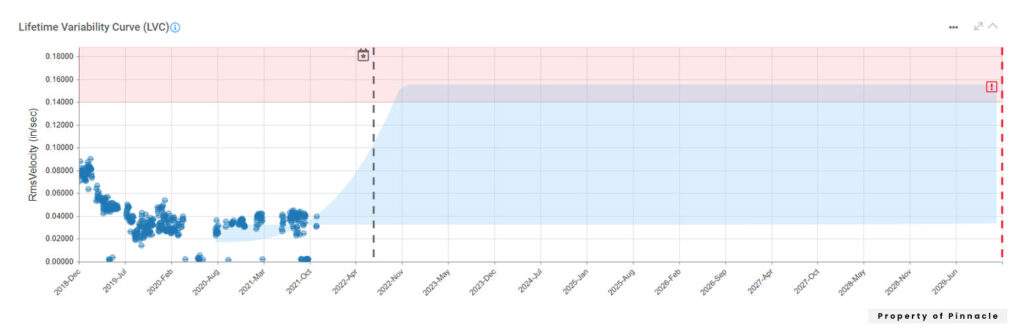
The Pinnacle team added exponentially increasing vibration measurements to the model to visualize the impact vibration will have on the pump bearing. Figure 5 shows the updated LVC with a new predicted failure date of early 2022.
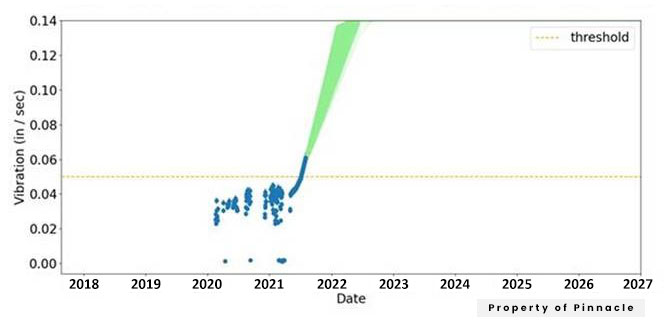
The Pinnacle team added exponentially increasing vibration measurements to the model to visualize the impact vibration will have on the pump bearing. Figure 5 shows the updated LVC with a new predicted failure date of early 2022.
Results
As a result of piloting QRO, the facility was able to visualize the impact of its data on failure and risk over time. The deliverables of the pilot included:
- Scenario Comparisons:
The most valuable result for the facility was its ability to model potential thinning and corrosion scenarios on all equipment types. By simulating various “What If” scenarios, facility leadership will be able to identify predicted failure dates and the associated PoF curves for both fixed and non-fixed assets within the platform.
- Risk Assessment:
The facility received a risk profile over time for each asset, allowing them to visualize the impact of historical and future activities and identify when assets cross various thresholds.
- Availability Forecast:
QRO calculated a forecasted availability of 94.22% for the selected group of 56 assets within the oil train, as shown in Figure 6. Previously, the facility was unable to forecast availability, but with QRO, the facility can now proactively predict availability and failure dates to better manage its assets. The primary drivers for the loss in availability were a lack of measured thickness data in a set of heat exchanger tube bundles and a lack of recorded maintenance history in a group of compressor seals. The lack of eddy current reports for the heat exchanger tube bundles resulted in an over-conservative estimated corrosion rate that increased the PoF.
Conclusion
After completing the pilot for the oil train, the facility is moving forward with implementing QRO on the remaining assets within the oil train and other gas trains at the facility, which includes 2,000 fixed and non-fixed assets. The expansion of the QRO implementation is expected to result in a 14% total inspection spend reduction, 6% total maintenance spend reduction, and 2-3% total utilization improvement through reduction of loss of containment events and downtime.
At the conclusion of the expanded QRO pilot, the facility will receive:
10-year availability forecast, which can be drilled down into PoF prediction for any equipment component
Top 10 contributors to unavailability and cost, which is updated as new data is uploaded into Newton™
Stay in the know.
Providing data-driven insights, perspectives, and industrial inspiration from the forefront of the reliability transformation.